 logo

Why do you need seven steps for using analytics to drive ROI effectively? Because running a small business, or any business today, you quickly find yourself drowning in data. It seems like everywhere you turn, every platform you use produces a variety of numbers that seem to defy analysis. As a result, IBM estimates that 65% of small and mid-sized businesses struggle to translate raw data into actionable insights. Lacking these actionable insights, companies can’t keep up with competitors who are able to utilize key metrics to make data-driven decisions that result in better performance, less waste, and more efficiency.
Using analytics to drive ROI turns the mush of data in the left-hand cereal bowl into clear insights, like you find in the right one. Don’t you think it’s worth reading the rest of this post to learn how you can use your data to drive insights that result in higher ROI? Well, read on!

How to use analytics to drive ROI
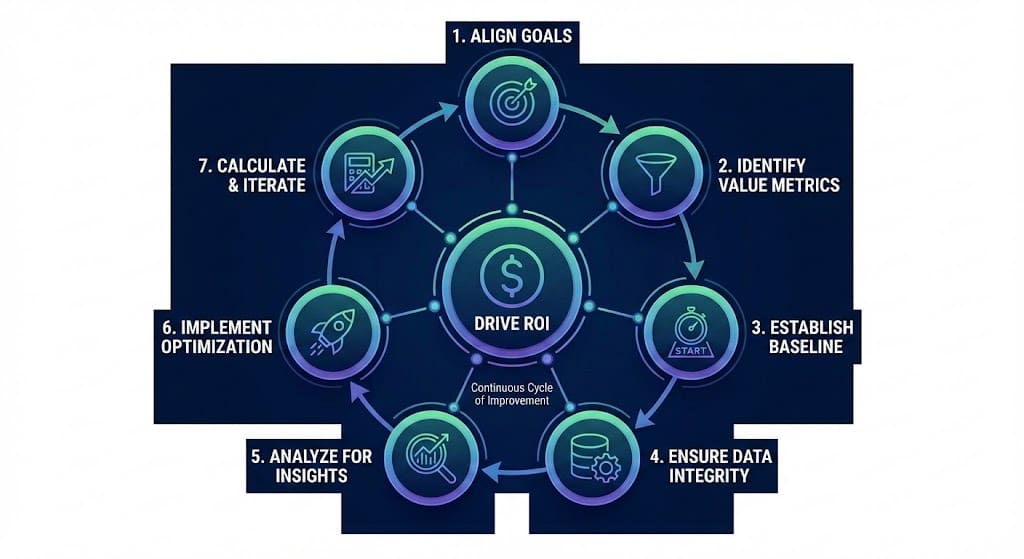
If your data currently looks more like the cereal on the left, then you need a systematic approach to analyzing the data to derive insights if you have any hope of using analytics to drive ROI. Next, we’ll walk you through the seven steps necessary to accomplish this goal. The image above summarizes these steps. After we discuss these seven steps, we’ll provide a practical analysis using this process to analyze a real dataset so you can see how it helps you crystallize your processes to build insights.
Step 1: Align metrics with your business goals
You should have established one or more goals when you wrote your marketing plan (if you haven’t written one yet, take some time to look at my advice on how to create one). Instead of exploring your data to see what metrics you can access, develop a list of questions related to success. For instance, what’s your goal for conversion rate? Or ask what percentage of your target market you hope to reach in the next six months?
Notice that in the questions I asked related to my success, I included both intermediate goals (reach) and terminal goals (conversion rate). This is a critical aspect of using analytics to drive ROI. It recognizes conversion as a process, not a point.
Thus, from a marketing perspective, you must focus on the entire customer journey, from first awareness of your brand, through to conversion, then past conversion to loyalty and advocacy. The entire process contributes toward higher conversion, hence every step is important, so you need goals related to each one.
See the funnel to the right. You need to put more visitors into the hopper, keep them flowing efficiently down the funnel, and guide them out the bottom — that’s maximum ROI.
Step 2: Separate key performance indicators (KPIs)
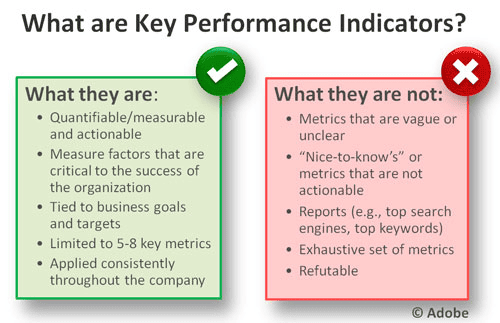
KPI, as implied in the image above, measure factors critical to your success. Avoid vanity metrics that might make you feel good, but don’t directly correlate with success. Examples of vanity metrics are follower counts and visits to your website.
Here are some KPIs that help you use analytics to drive ROI effectively.
Revenue growth
Customer satisfaction
Conversion rate
Return on ad spend (ROAS)
Unfortunately, these all reflect something we call terminal goals, which translate directly to the bottom line of your organization. By focusing on only terminal goals, as mentioned in the earlier step, you miss all the intermediate steps necessary to achieve these terminal goals. Hence, you need additional KPIs related to these process goals, such as:
Reach
Frequency
Most popular posts
Time on site
Number of pages scanned
Of course, your choice of KPIs is a function of your market, your strategy, and your specific industry. You also might set goals related to different target markets or personas. For instance, you might set goals for these KPIs for each persona.
Step 3: Establish benchmarks
Since KPIs are quantifiable, you want to establish a quantitative goal, which we covered when we discussed SMART goals in an earlier post. Thus, rather than hoping that KPIs for this year are better than last, you might set a goal of improving reach by 20% over the coming quarter. Now, you can use your metrics effectively as a means to use analytics to drive ROI.
While using past performance to benchmark your metrics is one effective tool, you might also benchmark performance against industry standards or competitor performance. This helps you set stretch goals that challenge your team toward higher levels of performance.
Step 4: Ensure data integrity

Data is sometimes messy. For instance, you get data from a variety of sources that might be in various formats. Your first step is to merge data from these sources before using analytics to drive ROI. Usually, that means creating a key to merge customer data with website data from customer logins, for instance. Also, the data might exist in different formats, such as the date might be in the common US or EU format. You must adjust these fields to form a uniform date.
Sometimes data comes in a corrupted format for any one of a number of reasons. If you can clean the corrupted data with clean data from another source, such as your CRM platform, you can replace it. Sometimes, however, the only solution is to delete suspicious data.
To avoid data integrity problems, test your algorithms or data segmentation on known data to ensure the equations are accurate before using them to process your new data.
Step 5: Analyze to drive ROI

You’re now ready to analyze the data to drive ROI. But you need to consider the output if you want to derive insights from your data more easily. Humans don’t do their best work assessing columns of numbers for meaning. Instead, use data visualizations to display data in a visual format that conveys meaning at a glance. Of course, poor visualizations can further obscure meaning, so it’s important to display data in the correct visualization that depends on the data and the kind of relationships that exist between them.
Some data is better visualized as a pie chart when you’re interested in the percentage of a whole, while gaining meaning from longitudinal data is better visualized as a line chart.
Gather all your visualizations into an interactive dashboard, such as one created using IBM’s Cognos. These dashboards connect to the original data to allow you to play “what if” games by changing how you segment the data or the date ranges.
You’re looking for anomalies or metrics that don’t fit expectations, patterns, and trends in your data, not the numbers. That is where insights live.
Step 6: Build insights to better ROI
Insights from your KPIs must inform decisions or you’ve wasted time, money, and effort in analyzing them. This is actually harder than it might sound. It takes a company with a culture of data-driven decisions rather than one that is invested in political decisions or ones made based on what’s been done in the past. If I had a dollar for every client who told me they were doing something because “that’s the way we always did it”, rather than taking my data-based advice, I could retire a millionaire.
Step 7: Monitor and iterate

You’re not done. Not by a long shot. You now have a process for making informed decisions. You need to iterate this process by monitoring your KPIs regularly (i.e., once a week), while some metrics you should monitor daily.
How to use analytics to drive ROI: An example
Now, you have a clear process that should help you use analytics to drive ROI effectively. But you might still have some questions about how to apply this process to real data. So, let’s move on to an example.
Steps one and two
I’m using an example of an e-commerce business using data provided by Google Analytics to help teach you how to use the analytics platform.
I established goals related to acquisition as well as acquisition by demographic groups. That led to KPIs related to organic, social, and ad reach.
I obviously had goals related to conversion, so I looked at the conversion rate, shopping cart abandonment, and multi-channel attribution modeling to find conversion by channel as my KPIs.
Step 3
I didn’t have clear baselines and Google obscures the industry that generated the data, so I couldn’t use industry benchmarks. I did use a comparison between period 1 and period 2 as a surrogate to complete this step.
Step 4
Again, since this is obscure data, I was forced to take the data at face value.
Step 5
This is where most of my effort went in demonstrating how to use analytics to drive ROI.
We created a table comparing the ROI of various age groups buying from our website. Google determines the age groups, so that’s a little awkward if you want more granular data, but we can clearly see what’s going on. In terms of conversion rate, we see that younger consumers, between 25 and 34, convert at a higher frequency than other demographic groups. But, we don’t stop there. We can also see, by looking at the Sessions column, that we’re also doing a great job in driving younger visitors to our site. We might consider doing something to increase visits from the 35-44 year olds, since they convert at nearly the same rate as our 25-34 year olds. At first blush, one strategy we might consider is driving more traffic from younger visitors. But let’s take a deeper look at all that this data tells us. Notice, I’ve included AOV (or average order value) in this table and it tells an entirely different story. Now, we see the importance of older visitors. Specifically, we see that 45-54-year-olds have a significantly higher order value than younger visitors. Unfortunately, we do a pretty poor job of converting these visitors — with a conversion rate of only 1.84%. Equally damaging is that only a little over 3000 sessions come from this very valuable group of visitors. This suggests an entirely different strategy — drive more visits from consumers 45-54 years old and improve conversion rates for this group.

More analytics to drive ROI
 So, let’s take a look at the other end of the funnel — acquisition. And, I have a visualization to reflect where visitors come from. Notice, in the pie chart, most traffic comes from Google (which is search traffic) and YouTube drives the next big chunk of traffic. Again, this suggests a strategy to focus on these two sources of visitors.
 But we can dig deeper (with totally different insights) by looking not just at where visitors come from, but also at how the source impacts ROI. And, I have a handy image to show that, as well. Now, look what we find — something totally different. Now, instead of a strategy that focuses on Google and YouTube, we see that the Google sandbox, mail, and Facebook drive ROI. You clearly see why those of us working in analytics call things like visits and sessions vanity metrics. They might make you feel good, but they don’t necessarily put money in the company bank account. In contrast, by looking at orders or conversions, we clearly see what strategic changes will increase ROI the most.
Step 6
I could go on like this forever, but I think you get the idea. Here are my key takeaways from today:
- Metrics reflecting ROI should dominate in forming strategy, not vanity metrics. Measure conversion, average order size (value), order quantity, transactions/ user, and other metrics that reflect sales.
- Track how segments contribute to ROI based on demographic values (age and gender are available in Google Analytics, but other tools may offer additional demographics such as income, education, etc), geographic values (GA offers city/country, but you might have other options on other platforms), mobile versus desktop (laptop), browser (as some browsers might not do a good job of rendering your pages effectively), and psychographics (GA now offers some of these, which they call interests). This list isn’t comprehensive and your industry may require additional segmentation variables.
- Don’t ignore other stages in the conversion process. I recommend doing a funnel for each segment to see how they move through your pages on the way to conversion. Pay special attention to shopping cart abandonment. Here’s an example of a funnel:

- Create visualizations that allow insights to emerge from the data.
- Analytics isn’t a set it and forget it kind of thing. Repeat this analysis periodically to make sure it’s still valid.
- Don’t stop with looking at the analysis. Change your strategies based on the insights provided.
- And finally, measure again after making strategic changes to see how the changes impact ROI. You may need to tweak it a bit to optimize your returns.

Step 7
Rinse and repeat every week or every month, depending on the velocity you experience in your business.
Need marketing help to support business growth?
We welcome the opportunity to show you how we can make your marketing SIZZLE with our data-driven, results-oriented marketing strategies. Sign up for our FREE newsletter, get our FREE guide to creating an awesome website, or contact us for more information on hiring us.
Hausman and Associates, the publisher of MKT Maven, is a full-service marketing agency operating at the intersection of marketing and digital media. Check out our affordable coaching programs to help your business thrive into the future.
Discover more from MKT Maven
Subscribe to get the latest posts sent to your email.


Informative and newsy! I found the blog quite assisting.I will use these techniques in my site as i was facing some problems in ranking but now I am clear what techniques I need to follow.
Thanks