 logo

Marketing metrics and marketing analytics are the new buzzwords in digital because small businesses that harness the power of data to build insights and make decisions stand head and shoulders above their larger competitors. KPIs (Key Performance Indicators) provide insights into what’s working and what isn’t, helping you optimize your efforts and budget to achieve better results. That’s how a firm like King Arthur Flour earned a place among the leaders in their industry.

Unlike traditional marketing, digital marketing yields a number of hard metrics (as opposed to squishy ones such as awareness). That’s why you’ll see digital marketing metrics dominate the discussion below. Because digital marketing produces a wealth of marketing metrics, it leaves us with the conundrum of WHAT metrics are important and which are vanity metrics (those that make you feel good about your campaigns, but contribute little to your success). And that’s the topic of our discussion today.
Let’s start today’s discussion by taking a look at how consumers progress from awareness to conversion and beyond.
The customer journey
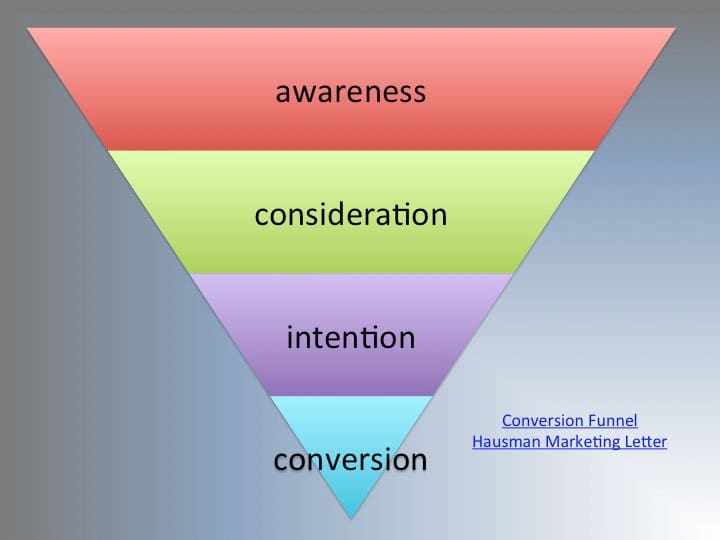
Below, you can see two images. The first depicts the traditional notion of the journey consumers take from awareness through conversion, termed the conversion process. This conventional image has significant value, particularly due to its funnel shape, which suggests that fewer consumers reach each successive level in the process, resulting in a relatively small number of consumers who become aware of your product that ultimately convert. Marketing is the process that accounts for how consumers enter and flow through the conversion process.
However, there are also problems with this depiction. First, consumers don’t move through the conversion process in a strictly linear fashion. Instead, they often cycle through stages, sometimes jumping back to an earlier stage, sometimes skipping a stage altogether. The second problem is that conversion isn’t the end of the process. Sure, they made a purchase, but increasingly, firms care about retaining customers so they return for future purchases. That’s why I developed the second image to depict the customer journey.

15 essential marketing metrics to measure, analyze, and interpret
The purpose of introducing the topic of marketing metrics with a discussion of the customer journey is to help you understand that the key metrics you need to improve performance must reflect each stage of the customer journey, as well as your success in driving consumers through them. Keep in mind that the discussion of marketing metrics below is divided between various marketing channels, but each channel reflects metrics reflecting as much of the customer journey as you can achieve with that channel. Let’s start with social media.
Social media metrics
I start our discussion with social media metrics because social media drives success at the awareness and consideration stages, although the incorporation of markets, such as Facebook Marketplace, and shoppable video, on TikTok, YouTube, and Instagram Reels, are beginning to contribute to conversion. The biggest impact of social media remains its ability to drive traffic into physical stores and your website. We’ll discuss later how to track social media performance through the website to conversion.
- Engagement rate is a key metric for several reasons. First, engagement rate, which depicts how users interact with your content through likes, comments, shares, and saves, demonstrates the success of your shared content. Armed with this information, you can improve engagement. Second, engagement rate impacts social media algorithms such that the higher your engagement, the more it is shown to users. Finally, engagement rate impacts SEO (search engine optimization) to improve the performance of your content on search.
- Reach is a reflection of the number of unique users who saw your content. Obviously, the more users who see your content, the more your opportunity to convert them.
- Frequency demonstrates how many times the average user saw your content. Since it commonly requires six to eight touchpoints to convert a user, the higher the frequency, the greater the chance of making a sale. Of course, this is a function of many variables, such as format (video is more effective than voice, which is more effective than text), time (too many touches in too short a time creates burnout; too few and users forget between times)
Email marketing metrics
Email marketing is commonly most effective for lead generation or the consideration and decision stages of the journey, so we’ll discuss that next.
- Open rate assesses how many of the emails you sent were opened. Since subscribers don’t see your content without opening, this is a key metric.
- CTR or click-through rate is a metric we see associated with many marketing tactics, including email marketing. CTR reflects the percentage of subscribers who clicked on one or more links contained in your email message. A high CTR demonstrates a strong call-to-action and compelling content. We’ll discuss this metric associated with other channels in later sections.
- The unsubscribe rate is a negative marketing metric because it represents recipients who no longer wish to receive messages from you. It might indicate your messages don’t meet the needs of the subscriber, you send email messages too frequently, or they never opted in to receive them in the first place.
Paid advertising metrics
Paid advertising runs the gamut from social media advertising on platforms like TikTok and Meta (which includes Instagram and Facebook, as well as Messenger) to search advertising. Social media advertising marketing metrics mirror those already discussed in that section, along with CTR (in this case, as a percentage of impressions). Additional marketing metrics include:
- Clicks reflect a compelling ad that entices users to learn more.
- CPC, or cost-per-click, represents the fees paid divided by the number of clicks the ad achieved.
- ROAS, or return on ad spend, can be calculated when you have metrics representing the conversion rate for each ad.
- In addition to these metrics, Google Ads provides a quality score, which represents a combination of how well the ad fits the landing page, prior engagement with the ad, and a few other variables. Importantly, the quality score helps determine how much each click will cost you.
Website metrics
Since conversion occurs on your website (with the exception of a few through social commerce) and in-store conversion is notoriously difficult to trace, you’ll find a richer discussion regarding metrics on this channel.
Because your website functions across a broad range of marketing tactics, your website is critical at all stages of the customer journey and we can assess your website across a broad range of marketing metrics reflecting each stage of the process, as well as a variety of marketing activities on a variety of channels to assess the performance of your website. The image below summarizes these marketing metrics, which stage the metric assesses, and which channels generate those metrics. Thus, it’s a perfect overview of the marketing metrics you should build into your analysis.

-
- Traffic reflects the number of visits and visitors to your website and, thus, represents how well you reach users across all channels. You can track traffic sources easily by using tools such as GA4 from Google Analytics to generate reports like you see in the dashboard below. By default, GA4 divides traffic (called sessions) into categories. Organic represents search traffic, while other sources are self-explanatory. Direct traffic shows how many visitors arrived without source information, such as using a bookmark, entering the URL directly, or from another site that didn’t pass along source information.
- A high bounce rate indicates that users are clicking on your website, but they navigate away without visiting another page. It’s often a reflection of poor navigation, poor performance, such as slow load times, or poor content that doesn’t provide any value.
- Average session duration is another way to assess how well your website works.
- A high cart abandonment rate can mean your checkout process is wrong. Here’s how to fix them.
- Offer a guest checkout rather than requiring users to create one or log in
- Offer multiple payment options and, for high-priced items, offer easy credit applications
- Be up front with costs so there are no surprises at checkout, such as shipping. Airbnb recently changed to incorporate this in its app to improve conversion.
- Simplify the checkout process as much as possible. For instance, Amazon offers 1-click checkout for logged-in customers.
- Conversion rate is often what folks think about when they think about marketing metrics because this is the metric that makes the cash register sing, even though conversion can refer to other goal completions, such as app downloads or email subscriptions.
Below is an interactive dashboard you can easily create using GA to summarize key website metrics. If this looks daunting, Google offers free training in how to use GA4, how to create dashboards, how to interpret data, and even offers sample data (which I used to generate this dashboard), you can use to play with these tools if that feels more comfortable. A number of online training schools also offer this training at a reasonable price. It takes time to learn this platform, but the payback from using GA4 effectively may be the difference between success for your small business and failure.

Key marketing metrics unrelated to the channel
In addition to channel-related metrics, we have a bonus five metrics that bridge the channel. Here you go:
- Customer acquisition cost (CAC) is calculated by adding the total cost of your sales and marketing efforts required to gain a new customer. A better acquisition process leads to a lower cost.
- Customer lifetime value (CLV) incorporates the last stage in my modern customer journey – repeat purchase. Obviously, after spending money to acquire a customer, you’d like to limit churn to keep that customer coming back to make additional purchases in the future. CLV reflects the value of a customer over time to understand the long-term profitability offered by your customers, as well as the value of different segments of your market.
- ROI is the ultimate measure of profitability. ROI is calculated by dividing net profit (after cost of goods sold) by costs. ROAS can assess the performance of an individual channel or campaign, while ROI assesses the overall profitability of your business. Some businesses use ROI to determine whether a specific course of action is worth it in terms of return by setting a minimum required ROI for new projects.
- Lead-to-customer conversion ratio reflects how well you convert leads to customers. It assesses the quality of your sales and marketing efforts.
A warning about vanity metrics
You may be a little surprised because we haven’t mentioned your favorite marketing metric or you feel we didn’t discuss marketing metrics you’ve seen in lists from other experts. While some unique situations do exist based on industry, market, or other elements that set your business apart from more common ones, most of the marketing metrics we failed to discuss are what experts call vanity metrics. In other words, they’re metrics that make you feel like you’ve done a good job, but bear little to no relationship to actual market performance. Here are some examples:
- Followers/ fans
- Number of subscribers
- Pageviews
- Impressions
However, even these metrics gain some value when you measure them as trends rather than considering only static counts. For instance, the number of fans is nearly meaningless, but your ability to gain new fans suggests you’re doing something right.
Improving interpretation to glean better insights
Recognize that, no matter how carefully you choose your metrics, they don’t tell a story until you analyze them to build insights, as shown in the analytics process below.

There are ways you can improve your marketing metrics to build deeper insights that lead to better decisions, resulting in higher performance. Here are ways to build deeper insights:
-
- Transform data into visualizations, as the human mind can more easily detect patterns and anomalies when viewed visually.
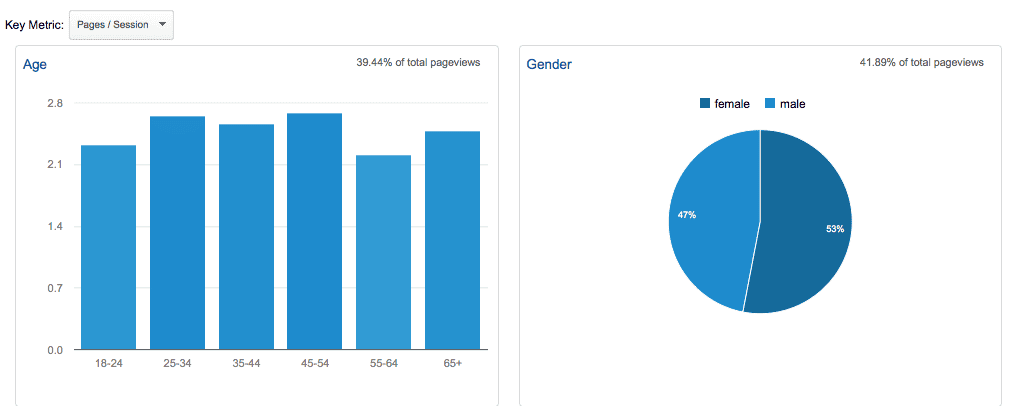
- Segment your data using Reports with GA4 to build more nuanced insights. For instance, break down conversion by customer segment, like I did in this image (which looks at sessions based on age and gender), to identify segments you’re not doing as well with. Then, you can create better campaigns to achieve better results with this segment.

Demographics based on PageViews/ visit - Compare performance over time, such as investigating year-over-year marketing metrics.
- Add tracking to individual campaigns to assess the performance of that campaign compared to others you’ve completed.
- Breaking up data by brand, country, region, or product allows you to develop more nuanced insights to improve performance.
Conclusion
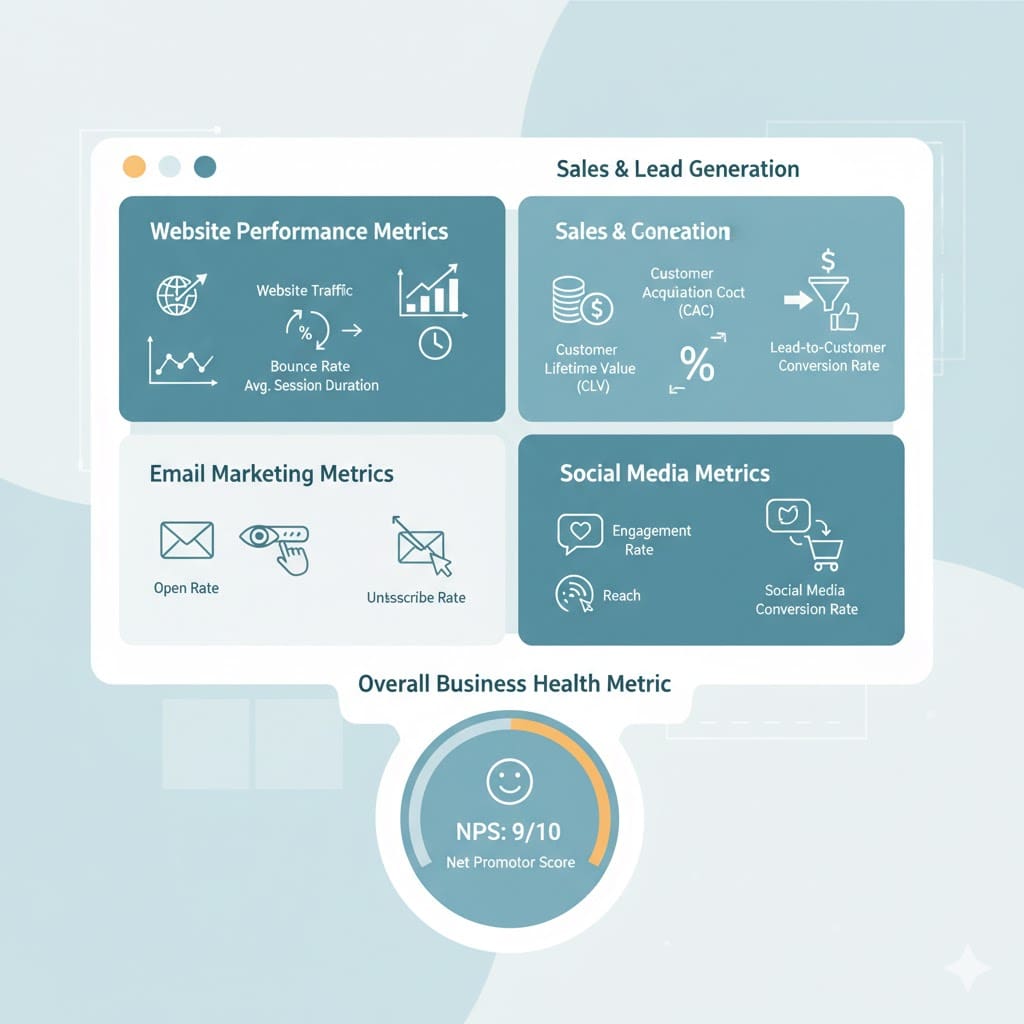
The figure below depicts the summary of most of these key marketing metrics, ending with the Net Promoter Score. which assesses customer loyalty and satisfaction by measuring how likely they are to recommend your company to prospective customers. A high promoter score indicates a healthy brand with future growth potential.
Need marketing help to support business growth?
We welcome the opportunity to show you how we can make your marketing SIZZLE with our data-driven, results-oriented marketing strategies. Sign up for our FREE newsletter, get the 1st chapter of our book on digital marketing analytics – FREE, or contact us for more information on hiring us.
Hausman and Associates, the publisher of MKT Maven, is a full-service marketing agency operating at the intersection of marketing and digital media. Check out our full range of services.
Discover more from MKT Maven
Subscribe to get the latest posts sent to your email.


