 logo

Some businesses struggle with the basics of social media analytics—getting past measuring likes, follows, and RT to understand the true impact of these metrics (and a few others, like reach and frequency) on their market success because that involves tracking those clicks through their website to assess goal completions from social media. Meanwhile, leading firms have moved well past these descriptive analytics to build insights that help optimize post times, determine which content serves best in generating leads, and identify shared characteristics of their best leads/ customers. Leading firms use predictive statistics to go beyond what worked and help predict what will work in the future, thus making data talk.
Because let’s face it! Data is totally meaningless.
Unless we can make our data talk, we can’t discover actionable insights that can help improve performance. The days of relying on manual processes to collect and analyze descriptive statistics are gone, replaced by more sophisticated efforts to predict what will happen rather than simply understanding what did happen. It’s these insights that drive performance to soar.
Making data talk isn’t easy. It relies on systematic data collection in real-time, translating data into meaningful insights with predictive analytics, and data visualizations that reduce mountains of data into pretty pictures to ease interpretation. It also means extending your insights beyond what happens on social media platforms to interpret clicks to your website and through your website to see how those clicks help you reach your goals.
Making data talk
What is the secret to making data talk?
That’s not a simple answer, as members on an IBM roundtable admitted today. Among the problems:
- No analysis tool works right out of the box. You must not only possess the ability to use advanced statistical tools like SPSS and Tableau but also understand the limitations of these tools so you know when a particular test won’t produce valid results or which data visualization form will provide the best insights. For instance, the visualization below shows network analysis and is great for understanding the relationship between a social profile, such as that belonging to an influencer, and connected profiles to see whether an influencer can offer value to your business or to determine how much value came through the influencer.

Image courtesy of KD Nuggets - Unfreezing existing business practices
- Separating insights from random relationships among data points
- Getting out of our silos – understanding that social media metrics contribute to overall BI (business intelligence)

Despite these problems, firms using advanced analytics get a 5-6% increase in results (as well as lower cost) over those who don’t — a result that dwarfs the problems involved with using them.
The right stuff
Putting together the right team is essential for making data talk. BI requires analysts schooled in sophisticated business modeling using tools such as Modeler, SPSS, SAS, Hadoop, and others designed to handle “big data.” It also requires that your team understand which tool can provide the best answers to your problem. For instance, predictive analytics relies on building algorithms, which is a basic regression function, while finding similarities among customers might use cluster analysis to find them and break your customer base into groups or segments to refine your marketing approach to each segment.
Recognize that making data talk is part art and part science. Thus, your team shouldn’t just be geeky and smart; they need to understand how people think—much like in the old hit series Scorpion, where the geeks need Paige to interpret the world around them despite their high-IQ team. Plus, there’s an art to understanding (and predicting) the needs of internal users and creating reports the rest of the team can understand. Thus, in addition to computer and statistical skills, your team needs behaviorists like marketers who understand consumer behavior and the buying process.
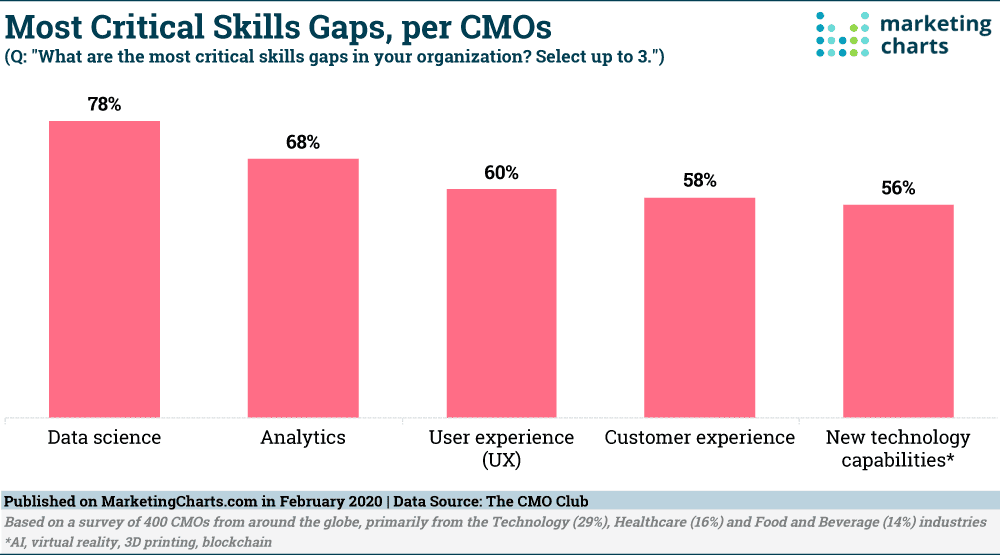
The tools for data analysis and behavioral theories change constantly, so investing in ongoing training is a must. As you can see in the graphic below, these skills in data science and analytics are the most critical skills gaps found in a study of CMOs.
Increasingly, those of us working in the analytics space see recommendations for BI teams to think more like academics. B2BMarketing has these recommendations about the science of data:
Modern social media monitoring and analysis demands a disciplined, scientific approach, rather than a non-scalable, miscategorised overview of online opinions. Social media is now sufficiently mature and pervasive that the only sensible approach is to develop quantitative analysis methods with teams of mathematicians, social scientists and statisticians; applying statistical theories and unique algorithms to analyse huge volumes of unstructured text. You’ll benefit most from systematically implementing a scientific methodology that moves from mere social listening to social intelligence. This means analysing the content of the social landscape, respectfully extracting meaning from public conversations, and making actionable sense of what is being said.
Unfreezing existing practices
Making data talk requires the right processes for collecting “clean” data. And that’s hard. I once visited a client to help them understand why profits were shrinking. As I waited for my appointment, I saw employees in their inbound call center collecting orders on paper forms with their computers pushed to the forward edge of their desks.
We’d implemented an EDI system the month before, so I couldn’t understand why employees continued to use paper. We’d done everything right. We got buy-in from employees, trained them, and worked together for a while, answering any questions. We hopped over to the inbound call center to ask employees why they still used paper forms.
We’re afraid the orders will get lost in the computer, then we’ll have no record. This way, we enter the order into the computer in the evening and have a paper backup in case something happens to the computer.
Wow, this just goes to show how hard it is to break old habits in an organization.
Another client stopped efforts to introduce advanced activity-based costing software because his older employees “just couldn’t get the hang of” using the computers.
Unfreezing problems occur when departments become territorial about their data –refusing to share it with the rest of the organization or when departments must implement a decision made by another department.
Sensible insights
It’s not enough to make data talk — you need to get accurate insights, not nonsense.

Relationships among your data underpin most predictive analytics. Some of these make sense, like the relationship between age and income (in general, our income rises as we get older). Some data relationships provide meaningful insights, so a relationship between the number of years you retained a customer and AOV (average order value) creates opportunities.
Some data relationships are simple nonsense, such as buying a ballet shoe and a fishing pole. Does this mean there are a lot of fishing ballerinas out there? More likely, the individual purchased one or both products as gifts for someone else. We call these spurious correlations, and they’re dangerous. Planning based on spurious correlations is likely to fail. As datasets get bigger, the number of spurious correlations generated goes up. For instance, in large datasets, the length of the average woman’s skirt correlates with the state of the economy. That’s just ridiculous and likely both are caused by something termed consumer confidence.
Getting out of functional silos
Many organizations still organize around function — operations, marketing, and finance … While modern management theory suggests these organizational structures don’t work very well, they’re deadly when it comes to making data talk. Not only does data get embargoed within the functional group so others don’t even know it exists, but functional thinking pervades the organization, making it hard for everyone to think about how x is related to y. When it comes to understanding how one functional area impacts the operations and performance of another functional area, knowledge gaps pervade thinking. When organized in functional areas, there’s resistance to change that can slow down the implementation of new ways of doing business, especially when recommended by another functional area.

Organizations are like ecosystems — every area contributes to the success or failure of every other area. They depend on each other. For instance, social media isn’t just a communication channel; it’s the source of consumer insights. When Mark, from Microsoft, noticed comments surfacing about the Surface computer right after it launched, he shared insights with the operations groups working on the next iteration of the Surface so they could enhance its user experience. Ensuring that all areas of the organization work together, pulling in the same direction, is a key component of success.
Examples of firms making data talk
Forbes demonstrates how a telecommunications company combined big data across all marketing channels — social and traditional media spends with sales and customer use data across social platforms to build a model quantifying the impact of their marketing spend. Results showed the importance of customer engagement with the firm’s call center — which performed poorly in the eyes of customers. By shifting spend from traditional media to improve call center performance, the firm improved customer sentiment and increased revenue by millions of dollars.
The key to using big data is to keep it simple — and manageable. Tahari, the women’s clothing company, found the benefit of KISS (keep it simple, stupid) early in their BI journey. Using visualizations to summarize a 200-page report brought actionable insights to managers who failed to find the same kernels in the longer report. After building a predictive model based on 3 years of sales data, managers can better predict which sizes and styles will sell to a given retail store and how a retail sale impacts demand from their retail buyers. Armed with this knowledge, the company does far less air shipping (at 3X the cost) and more shipping by boat from their manufacturing sourced in the Far East.
Some final thoughts on making data talk
Yesterday, I attended an analytics roundtable organized by IBM, which prompted this post. IBM obviously touted its own tools, but several companies make products that create similar insights for your business. In fact, Predictive Analytics Today curated a list of the top 21 brands, including IBM, SAP, SAS, and Oracle. Of course, these tools change all the time, so it’s important to hire folks with the right skills (or hire an agency with them if your needs don’t require full-time employees), then spend the money to train them as tools, techniques, and consumer theories change. Remember, that data analytics is part art and part science, so hire folks training not only in data analysis but in behavioral theories to get the most bang for your buck.
Using the right tool in the right way helps firms turn data into insights, hence making their data talk. Data visualizations make it easier to turn data into insights as it’s easier to glean meaning from a chart than reading columns of data. However, the wrong visualization can be worse than none, so learn how to use different forms of visualization and what types of insights you can develop from each form. For instance, line graphs help track performance over time, while pie charts are best for understanding how something is split into segments, such as age groups.
Getting your data to talk isn’t an end unto itself. You need to take the insights gleaned from data analysis and develop new ways of operating or improve existing operations. Otherwise, you’ve just wasted time, effort, and money developing the insights.
The wrong organizational structure interferes with developing insights (by siloing data) and implementing change based on those insights. Operating using a flat or open organizational structure (view the image of different types of organizational structures shared earlier) makes it easier to share information and implement changes based on insights from that data.
Need marketing help to support business growth?
We welcome the opportunity to show you how we can make your marketing SIZZLE with our data-driven, results-oriented marketing strategies. Sign up for our FREE newsletter, get our FREE guide to creating an awesome website, or contact us for more information on hiring us.
Hausman and Associates, the publisher of MKT Maven, is a full-service marketing agency operating at the intersection of marketing and digital media. Check out our full range of services.
Discover more from MKT Maven
Subscribe to get the latest posts sent to your email.


