 logo

A tailored dashboard can transform the way your business analyzes data across different departments. By integrating information into one cohesive platform, such a dashboard allows teams to operate seamlessly, improving communication and understanding between varied business units to improve the overall performance of your organization. With a tailored dashboard, you eliminate the need to juggle multiple spreadsheets, transforming analytics into insights that are more efficient and actionable so your performance soars. This streamlined approach empowers employees to focus on strategic tasks because they spend less time sorting through scattered data. Tailored dashboards provide clarity, enabling informed decisions that drive the company forward.
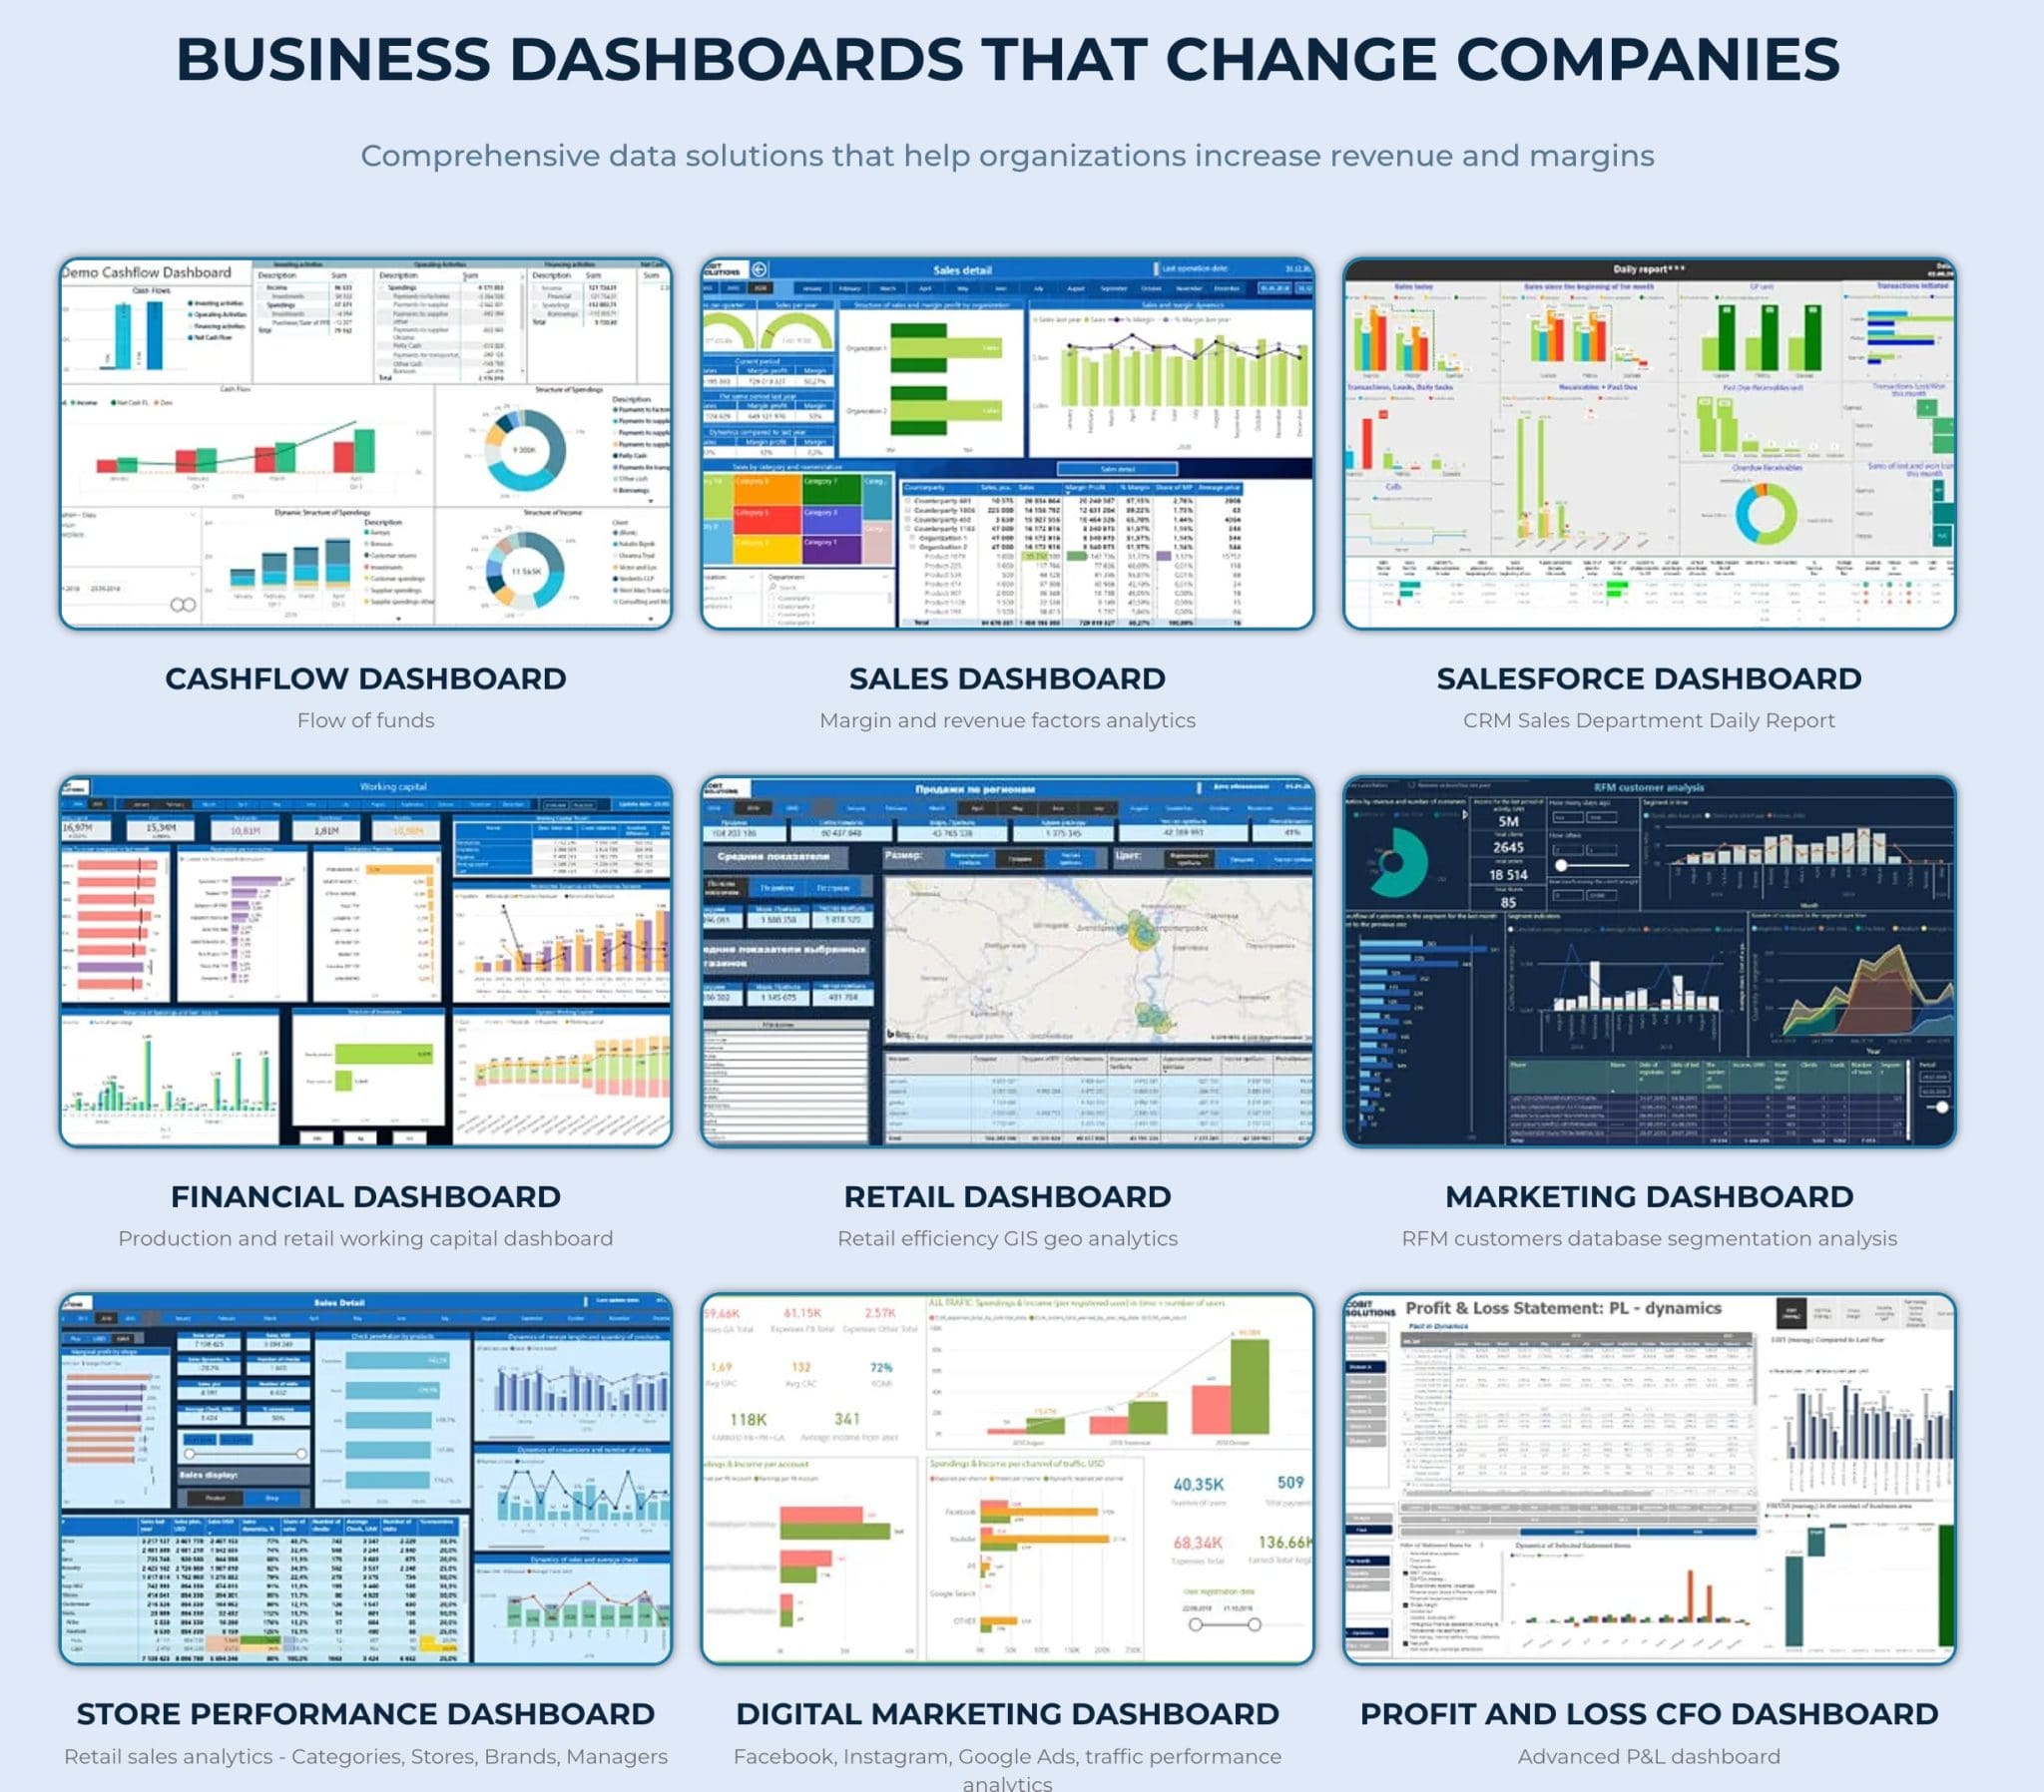
Above, you see the various dashboards generated to analyze the performance of multiple departments within an organization. While helpful in guiding actions in each department, these dashboards fail to provide the strategic decision-makers within an organization with the critical information necessary for strategic decisions, such as new product development, acquisition, and long-term growth.
Benefits of a tailored dashboard
The essential advantage of a tailored dashboard is that each department can view the data most relevant to them, promoting insightful collaborations. For instance, marketing and finance teams can work closely by sharing metrics without misinterpretations or delays. With the ability to customize the dashboard, every department can fine-tune its analyses, pinpointing trends that might have gone unnoticed while embedding that data within the overall organization to see where that department fits within the larger organization and allowing the C-suite executives to make overarching decisions on the direction best suited for the organization. Tools such as Zendash’s custom dashboard bring all your necessary data points into a single view, offering more precise insights and faster decision-making. Each department’s unique needs are met without compromising the integrity of data accuracy.
Using a tailored dashboard can also save a significant amount of time and other resources. Teams are equipped with tools that reduce redundant tasks, ultimately reinforcing a culture of productivity and improving communication between departments. This improvement leads to better resource allocation, as time previously spent on data gathering can now be invested in strategy development. As a result, organizations become more agile and capable of responding effectively to market changes. This approach transforms your organization’s data into a continuous improvement cycle, encouraging innovation and growth.
Essentials of tailored dashboard design for analytics integration
A tailored dashboard can help streamline analytics by effectively integrating critical data across multiple departments. Focusing on specific dashboard types, customization considerations, and the importance of data integration and real-time insights can improve their impact.
Understanding dashboard types and their impact
There are various types of dashboards, each serving a unique purpose, as shown in the image shown earlier, as well as dashboards created for different levels of analysis. Operational dashboards focus on daily activities and require real-time data to monitor ongoing processes. Analytical dashboards help with complex data analysis, allowing more profound insights into business performance. Strategic dashboards provide a long-term view of data to support policy decisions, while tactical dashboards are essential for mid-term analysis and serve departmental needs.
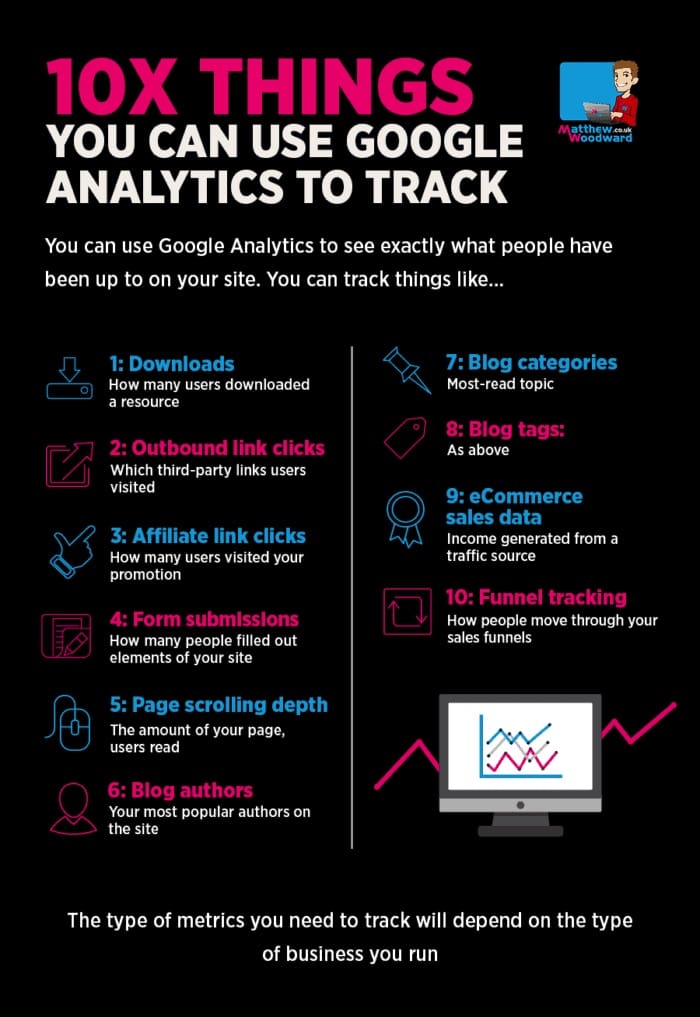
Choosing the right type for your organization can optimize data visualization. Operational dashboards often use real-time data from sources like Google Analytics (see example below) for instant decision-making and trend analysis. Tactical dashboards may rely on software like Power BI to offer in-depth trend analysis. Each type has its unique requirements, so understanding these can improve the effectiveness of your dashboard.
Key considerations for effective dashboard customization
Customization is important for tailoring dashboards to meet specific departmental needs while also reflecting your brand identity. When designing a dashboard, consider the user-friendly interface as a key factor. Filters and customization options should allow users to view only the most relevant information, improving usability.
Incorporate your brand’s identity into the design through color schemes, logos, and fonts. This not only improves visual appeal but also reinforces brand consistency. Tools like Looker Studio offer flexible customization options that can adapt to different industry needs. Additionally, assess the specific needs of each department to guarantee the dashboard provides actionable insights that align with their unique goals.
Data integration and real-time insights
Data integration is necessary to view your organization’s performance comprehensively. It guarantees that all data sources are connected, offering real-time insights. This can be achieved through platforms like a Power BI reporting dashboard, which integrates data from multiple systems. Real-time insights are essential for quick decision-making, allowing users to respond swiftly to changes or issues.
When integrating data, guarantee that the dashboard can handle diverse data sets. This includes linking databases, cloud services, and analytics tools without compromising performance. The result is a dashboard that consolidates information and improves the ability to derive meaningful insights swiftly, facilitating better decision-making across departments.
Leveraging data analytics for interdepartmental decision-making
Data analytics can improve decision-making by clearly viewing performance metrics across different departments. This helps teams align their goals, improve collaboration, and more effectively understand market trends.
Key performance indicators (KPIs) and metrics for cross-departmental alignment
Key Performance Indicators (KPIs) are important tools in aligning departmental goals. By using consistent KPIs, departments like sales, marketing, and operations can work towards common objectives. For instance, sales performance and campaign performance metrics can help marketing and sales teams assess the effectiveness of their strategies (see below). It is important to choose KPIs that are meaningful for all departments involved in creating a tailored dashboard. Actionable insights gained from these metrics lead to more precise decision-making processes. Data analysis helps identify these indicators, guaranteeing they stay relevant and valuable.
Improving collaboration and data-driven culture
Fostering a data-driven culture encourages seamless collaboration across departments. By sharing insights and data, teams can make informed decisions faster. Cross-functional collaboration becomes smoother when departments have access to the same data resources. Inventory management information, for example, can aid the operations department in optimizing stock levels, benefitting multiple teams. Regular reporting and shared platforms improve transparency and trust. Focusing on data-driven decision-making enables diverse teams to contribute to shared business goals.
Understanding and visualizing market and business trends
Gaining insight into market trends is necessary for staying competitive. Visualizing trends with business intelligence tools aids in spotting emerging opportunities. Understanding patterns in business performance allows departments to adjust strategies proactively. For instance, noticing a shift in consumer preferences can lead to more targeted marketing campaigns. Visualization tools make complex data more accessible and easier to interpret. Actionable insights from these tools allow departments to react rapidly to changing market conditions.
Conclusion
A tailored dashboard can significantly boost efficiency across departments by providing real-time insights and easy access to data. It helps you track performance metrics and gather important information without delay. When teams have access to the same up-to-date data, collaboration becomes seamless. This streamlined approach saves time and supports better decision-making. By integrating customized features, your organization can address specific needs and improve overall productivity.
Need marketing help to support business growth?
We welcome the opportunity to show you how we can make your marketing SIZZLE with our data-driven, results-oriented marketing strategies. Sign up for our FREE newsletter, get our FREE guide to creating an awesome website, or contact us for more information on hiring us.
Hausman and Associates, the publisher of MKT Maven, is a full-service marketing agency operating at the intersection of marketing and digital media. Check out our full range of services.
Discover more from MKT Maven
Subscribe to get the latest posts sent to your email.


